Transforming Raw Data into Insightful Stories That Drive Action At Jordan Turner Data, we turn complex data into clear, interactive, and visually compelling dashboards and charts that help businesses make better, faster, and smarter decisions. Whether you’re looking to understand your KPIs, uncover hidden trends, or present data to stakeholders, our data visualization services bring clarity and impact to your data.
Data Visualization
Data Visualization Matters
Why Data Visualization Matters
Data is only as powerful as your ability to understand and act on it. With the ever-growing amount of information available, businesses often struggle to extract meaningful insights from raw data. That’s where data visualization comes in.
We help bridge the gap between raw numbers and actionable insights by using cutting-edge tools like Tableau, Power BI, Looker Studio, Excel, and custom D3.js visuals.
Tools & Technologies We Use
Power BI
Tableau
Looker Studio (Google Data Studio)
Microsoft Excel and Google Sheets
D3.js & JavaScript Visualization Libraries
Our Data Visualization Solutions
At Jordan Turner Data, we offer a full range of tailored data visualization services:
Interactive Dashboards
Create real-time dashboards that allow you to explore and filter data easily. Perfect for executives, analysts, and teams who need up-to-date insights.
Business Reports & KPI Dashboards
Visualize your most important metrics with clarity. We design reports that highlight what matters most..
Custom Visual Design
Need something specific? We build custom charts and visuals that match your branding and support complex data relationships with intuitive design.
Data Integration
We connect your dashboards with various data sources: Excel, Google Sheets, SQL databases, cloud storage, APIs, and more—for seamless data updates.
Secure & Scalable Visualizations
From small startups to enterprise-scale data flows, we ensure your visualizations are secure, scalable, and easy to maintain.
Real-Time Data Monitoring
Stay on top of your operations with real-time data visualizations. We build dashboards that automatically update as new data flows..
Who We Serve
We work with startups, agencies, and enterprises across various industries:
E-commerce & Retail
Finance & Investment
Healthcare & Life Sciences
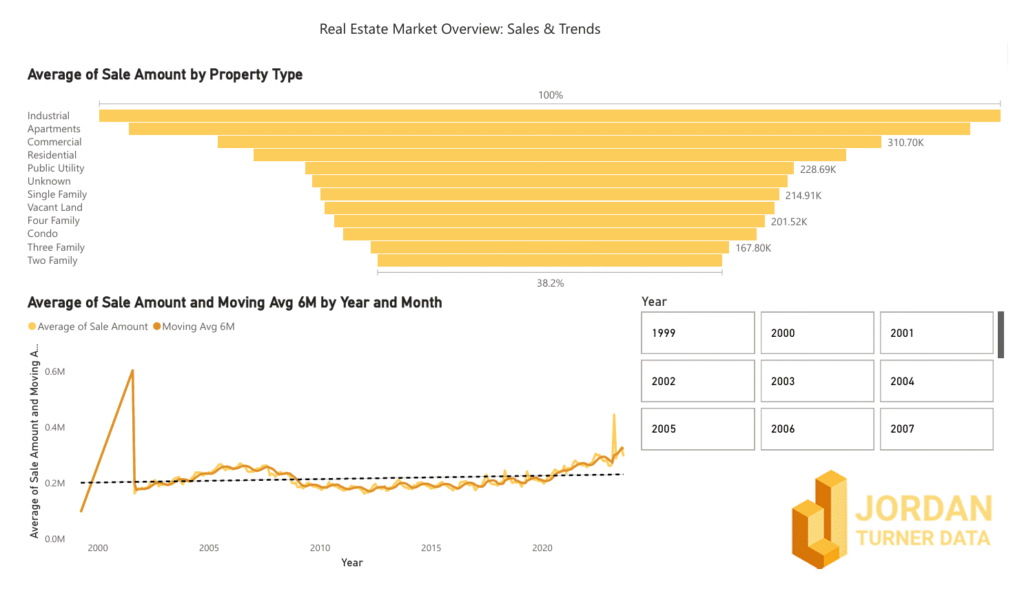
Real Estate
SaaS & Tech Companies
Education & Research
Whether you’re building your first dashboard or upgrading your data reporting strategy, we help you communicate data clearly and effectively.
Why Choose Jordan Turner Data?
✅ Expertise in Visual Storytelling We know how to transform raw data into narratives that decision-makers understand and trust.
✅ Customized Approach Every business is unique. Our visualizations are tailored to your goals, audience, and brand.
✅ Fast Turnaround Get data visuals delivered on time—without compromising quality.
✅ Ongoing Support From dashboard optimization to maintenance, we provide continuous support to keep your data working for you.s.
Let’s Visualize Your Data
Are you ready to unlock the full potential of your data? Let Jordan Turner Data help you visualize insights that inspire action. Contact us today for a free consultation or explore our portfolio to see real-world data visualization success stories.