🧩 Project: Ecommerce Sales Performance Dashboard
🔥 Problem:
Marketers and analysts relied on static Excel reports, with no quick way to filter by age group, payment method, date range, or location—slowing decision-making and obscuring emerging sales patterns.
🔍 Discovery & Research:
• Examined raw transaction data (55K orders, 29K unique customers) for key dimensions: Age Group, Purchase Method, Date, and Location
• Calculated critical KPIs: total revenue, transaction count, customer count, top payment channel, top-revenue city
• Identified need for trend visualization and automated insights to replace manual summary tables
🛠️ Solution:
• 🎯 Created slicers for Age Group, Payment Method, Purchase Date (range slider), and Location
• 💡 Designed KPI cards for Sum of Net Amount, Total Transactions, Unique Customers, Top Payment Method, and Top Location
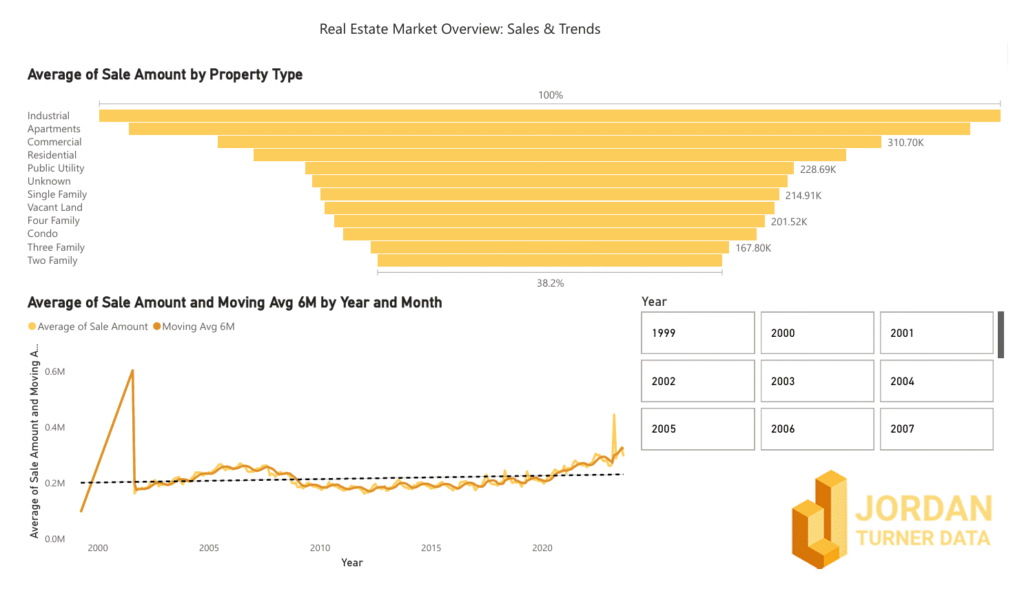
• 📈 Built an area chart (“Sales Trend Over Time”) to show revenue seasonality
• 📊 Added bar chart for “Sales by City” and pie chart for “Sales Breakdown by Payment Method”
• 🤖 Configured Smart Narrative (AI Insight Summary) to surface key takeaways automatically
📊 Tools Used:
• Power BI Desktop
• Power Query M (data cleansing & type conversion)
• DAX (measure and summary calculations)
✅ Outcome / Results:
• ⏱️ Cut manual reporting time from hours to real-time, interactive exploration
• 🔍 Enabled on-the-fly filtering to uncover high-value customer segments and top revenue drivers
• 🚀 Demonstrated a fully self-service dashboard delivering instant, data-driven insights
👤 My Role:
Led the end-to-end case study build: ingested and prepped the ecommerce dataset, authored all DAX measures, designed visuals, and set up the Smart Narrative for automated commentary.