In today’s dynamic property landscape, the real estate industry is increasingly relying on data to make smarter, faster decisions. With the explosion of big data, professionals in the field are turning to data visualization freelancers to help transform complex figures into understandable, actionable insights. Real estate firms, brokers, investors, and urban planners all stand to benefit from the power of interactive dashboard development—particularly when it’s tied to business intelligence dashboards that are tailored to their market goals.
At Jordan Turner Data, we specialize in helping real estate professionals tap into the hidden potential of their data. Whether you’re tracking market trends, analyzing property values, or comparing investment portfolios, visual storytelling can radically enhance your strategic capabilities.
Why Data Visualization Matters in Real Estate
Real estate markets are driven by variables like location, demographics, property types, price fluctuations, and macroeconomic factors. Making sense of these multiple data streams can be daunting—especially when decisions must be made quickly and with confidence.
This is where data visualization freelancers become indispensable. With their ability to create sleek, purpose-built charts, maps, and visuals, they help stakeholders quickly understand emerging patterns and outliers. Instead of wading through endless Excel rows, decision-makers can get insights at a glance.
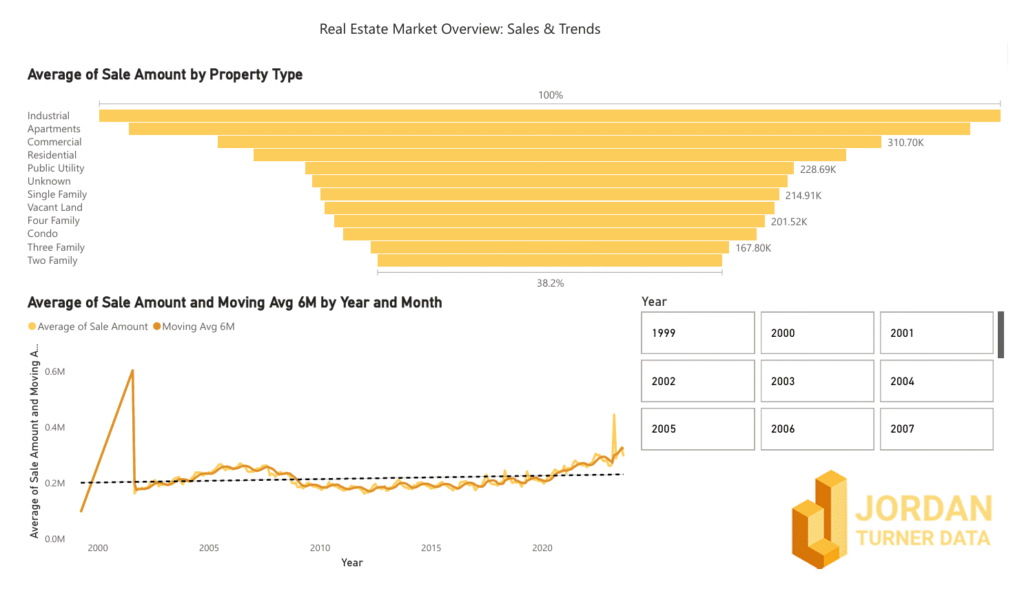
Key Use Cases for Interactive Dashboards in Real Estate
- Market Trend Analysis
Imagine a regional developer trying to decide which neighborhood to invest in next. By using interactive dashboard development, they can monitor property sales, rent trends, and construction activity in real time—broken down by zip code, property size, or demographics. - Portfolio Performance Tracking
For real estate investment trusts (REITs) or individual investors, business intelligence dashboards can visualize ROI, occupancy rates, and cash flow performance across multiple assets. This enables smarter capital allocation and risk management. - Property Valuation Comparison
Real estate agents can use side-by-side visuals to compare property values over time, even across different cities. With interactive sliders, filters, and geographic overlays, insights become immediate and easy to interpret. - Lead & Client Engagement
For brokerages and agencies, engaging dashboards can improve client interactions. Instead of static presentations, dynamic dashboards allow clients to explore listings, compare amenities, and visualize commute times or school zones—improving both trust and close rates.
Building Real Estate Dashboards that Drive Action
At Jordan Turner Data, we take a consultative approach to crafting real estate dashboards. Here’s what we focus on:
- Custom metrics tailored to your market (e.g., price per square foot, time-on-market trends, absorption rates)
- Interactive filters for users to drill into the data they care about (location, price range, year built)
- Map visualizations using geographic data layers (for zoning, flood zones, walkability, etc.)
- Predictive analytics to forecast market trends based on historical and economic indicators
Whether you’re a boutique brokerage or a multi-city developer, our team delivers interactive dashboard development that gives your organization a competitive edge.
Why Hire a Data Visualization Freelancer?
Hiring a full-time data analyst isn’t always practical—especially for mid-sized firms or project-specific needs. That’s where a data visualization freelancer like Jordan Turner Data becomes a valuable asset.
With flexible engagement models, deep industry experience, and the ability to integrate tools like Power BI, Tableau, and Google Data Studio, freelancers can deliver high-impact visual solutions quickly—without the overhead of a permanent hire.
Plus, we understand the nuances of real estate data: from MLS exports to CRM integration and public records data, we ensure your dashboards reflect the truth behind your numbers.
Business Intelligence Dashboards in Action
Here’s a real-world example from one of our recent clients:
A multi-family housing developer in Austin needed to evaluate lease-up rates and rental yield across 12 new properties. Within a week, we built a business intelligence dashboard that aggregated lease performance, competitor rates, and amenity benchmarks into a single interactive view. The result? A 17% improvement in pricing strategy and more confident executive reporting.
This is the power of data visualization freelancers who understand your industry.
Final Thoughts: Make Your Data Work for You
The real estate market will only become more data-driven in the years ahead. Whether you’re focused on development, investment, or brokerage, having the right business intelligence dashboards can mean the difference between reacting to trends and leading them.
By partnering with a trusted expert in interactive dashboard development, you can unlock deeper market insights, increase transparency, and make data-backed decisions with speed and clarity.
At Jordan Turner Data, we’re passionate about helping real estate professionals turn raw data into visual narratives that inform and inspire. If you’re ready to see what your data is really saying, reach out to us today.
Interested in a custom real estate dashboard?
Let’s chat! Whether you’re looking to upgrade your analytics or build from scratch, our team of experts is ready to help you visualize your future.