At Jordan Turner – Data Visualization & Dashboard Expert, we offer a suite of services designed to help you unlock the true potential of your data. Whether you’re looking to simplify complex datasets, build powerful dashboards, or develop custom data solutions, we’ve got you covered.
Services
Our Best Services
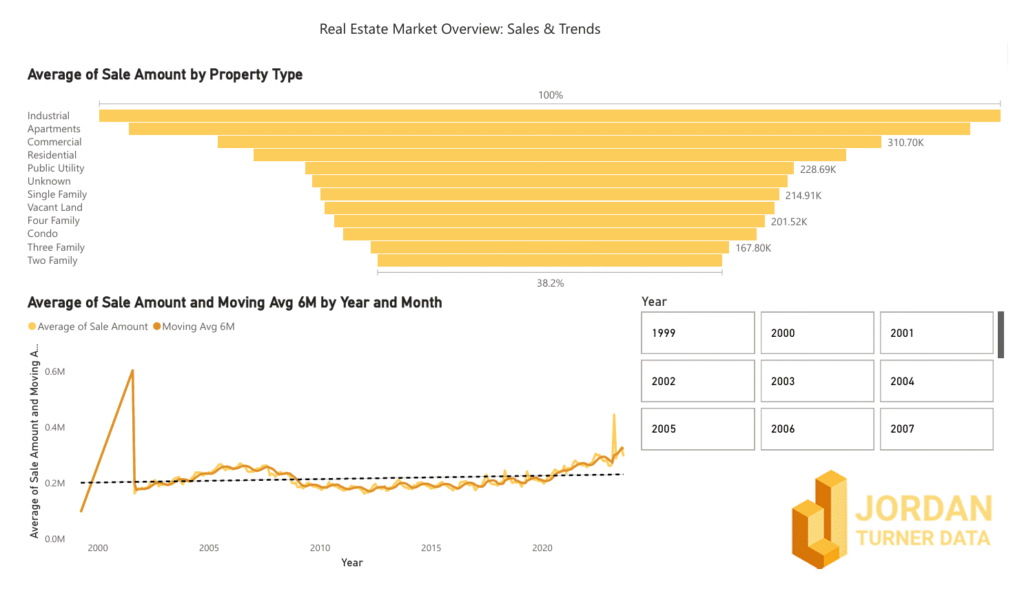
Data Visualization
Transform raw data into powerful insights. We specialize in creating compelling and easy-to-understand data visualizations that tell a story. From charts and graphs to interactive reports, our visualizations help businesses make informed decisions faster.
What We Offer:
Custom visual reports
Interactive charts and graphs
Data storytelling for stakeholders
Tools: Power BI, Tableau, Google Data Studio
Optimize decision-making through clear, beautiful, and impactful visuals.
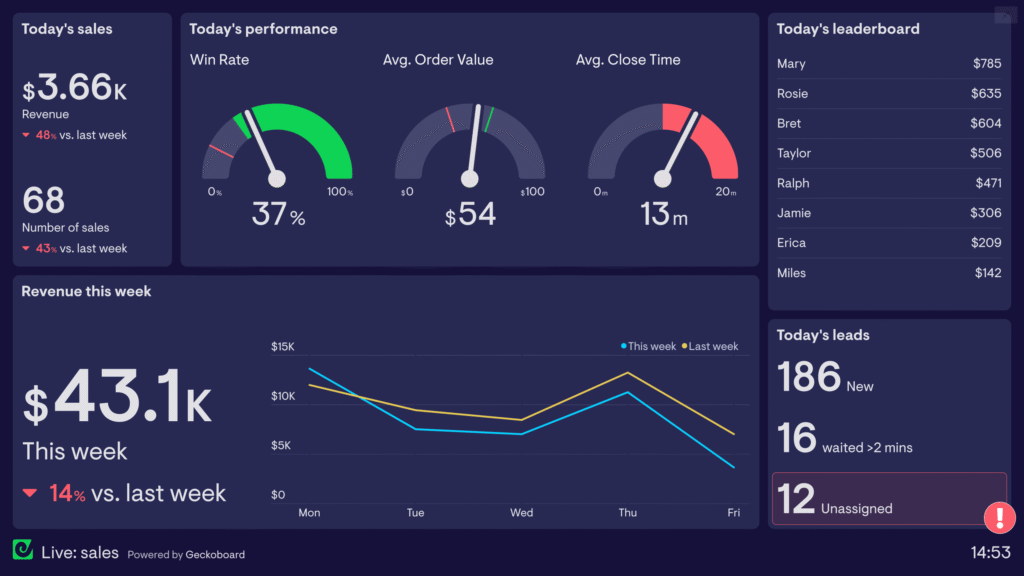
Custom Dashboards
Real-time insights at your fingertips. We design and build custom dashboards tailored to your business goals. Whether you’re tracking KPIs, monitoring performance, or managing operations, our dashboards are built for clarity, usability, and real-time data access.
What You Get:
Fully interactive dashboards
User-friendly interfaces
Mobile and desktop responsiveness
Integration with databases, APIs, and cloud tools
Empower your team with dashboards that turn numbers into action.
Development for Data Projects
From idea to implementation, we handle it all. Our development service bridges the gap between raw data and fully-functioning applications. We provide end-to-end solutions—whether it’s backend development, database integration, or building custom data tools from scratch.
Services Include:
Data pipeline and ETL development
API integrations
Custom tool or platform development
Automation scripts and backend support
Turn your data vision into reality with reliable, scalable development.
Why Choose Us?
Over [insert years] years of experience in data projects
Proven track record of delivering insights that drive action
Expertise in Power BI, Tableau, SQL, Python, and more