I specialize in turning complex data into clear, compelling dashboards and interactive visualizations. Below is a curated selection of projects I’ve worked on
Portfolio
See My Work — Data That Tells a Story
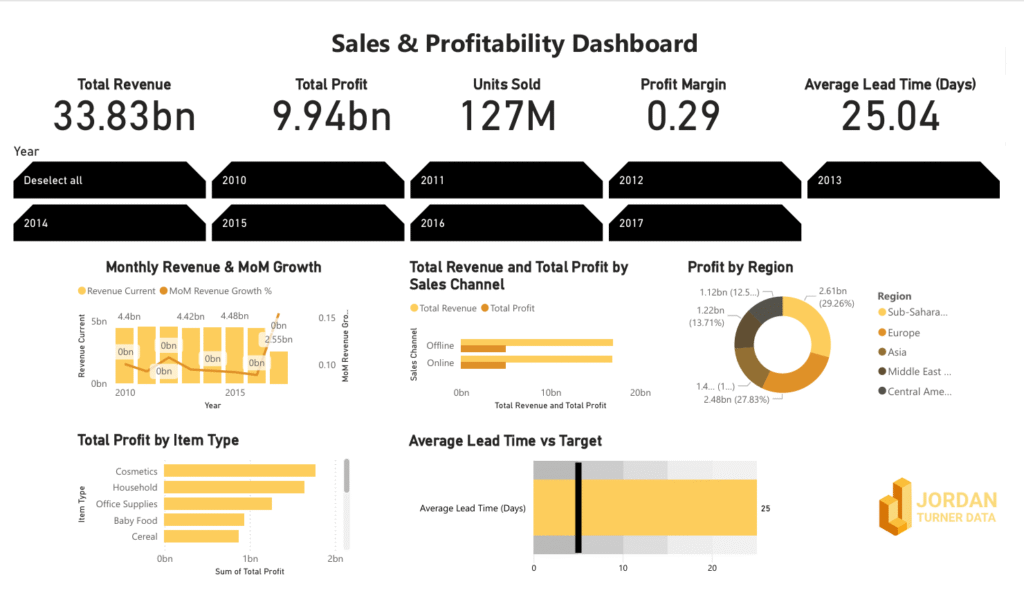
Sales & Profitability Dashboard
This Sales & Profitability Dashboard presents a comprehensive overview of business performance across key financial metrics. It includes total revenue, profit, units sold, profit margin, and lead time, with interactive filters by year. Visuals highlight monthly revenue trends, profit distribution by item type and region, and performance across sales channels. The dashboard also compares average lead times against targets to surface operational bottlenecks. Built for internal use and client reporting, this dashboard provides fast insight for strategic decision-making.
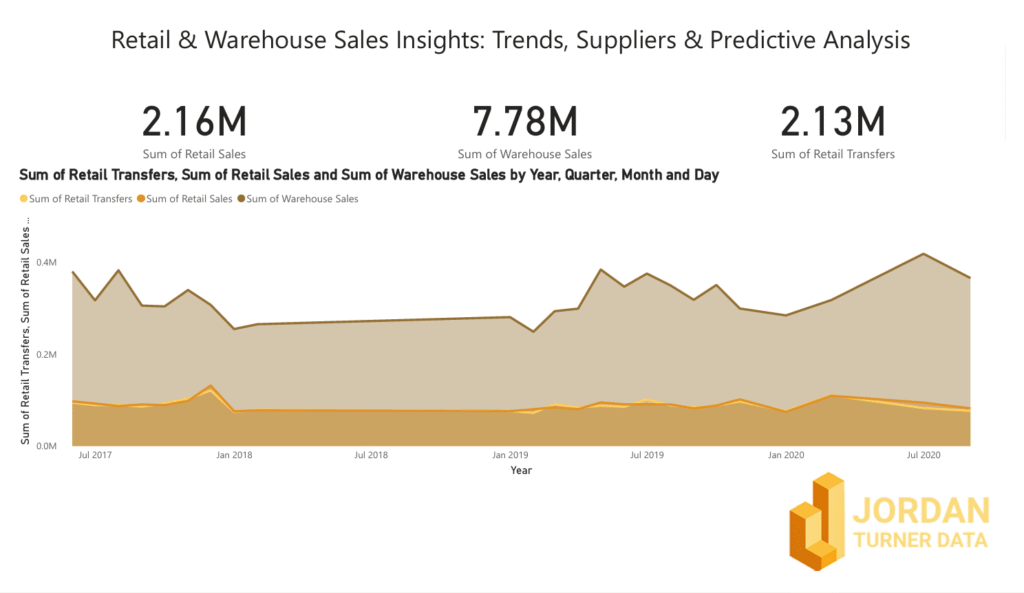
Retail and Warehouse Sales Data Dashboard with Ml integrations
This Retail & Warehouse Sales Performance Dashboard provides an in-depth analysis of sales trends, supplier contributions, and predictive insights. It visualizes key metrics such as total retail sales, warehouse sales, and retail transfers over time, enabling trend identification. Supplier performance is highlighted through bar charts and a detailed sales breakdown, while clustering and ABC categorization segment sales based on value distribution. Additionally, predictive analytics compare actual and forecasted retail sales. This dashboard is designed to support data-driven decision-making, helping businesses optimize inventory, track supplier impact, and forecast sales trends effectively. Built using Power BI with advanced data visualization techniques.
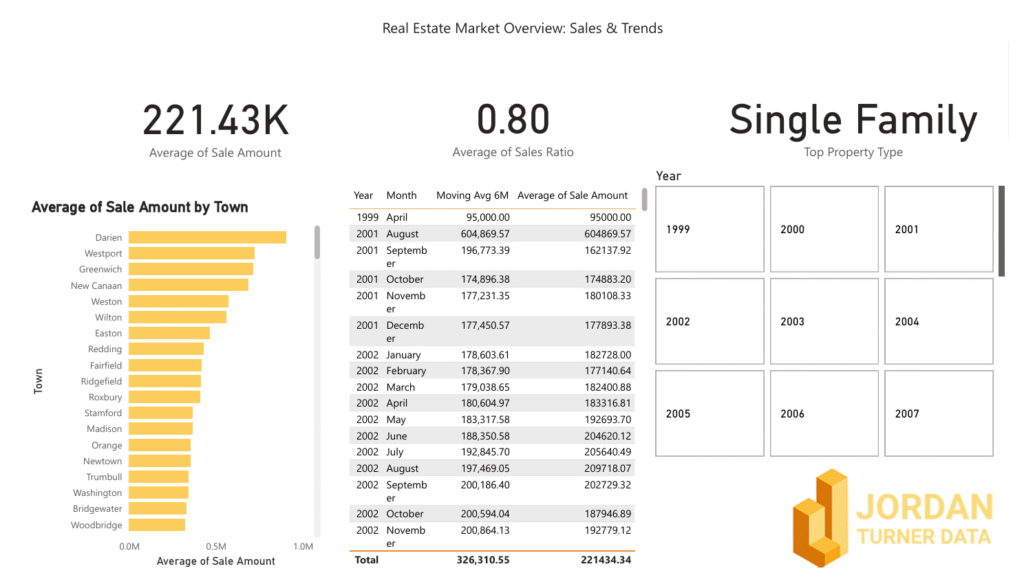
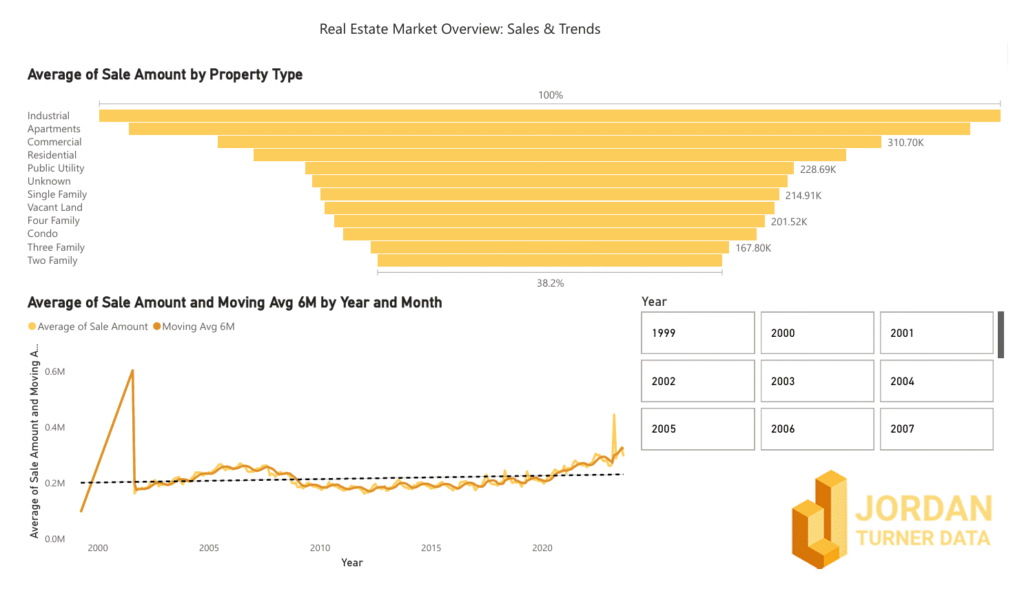
Uncover 20+ years of real estate trends 📈 – How have home prices changed over time? – What towns see the most sales? – Which property types dominate the market? Before: Raw sales data 📊 → After: Actionable investment insights 💡.
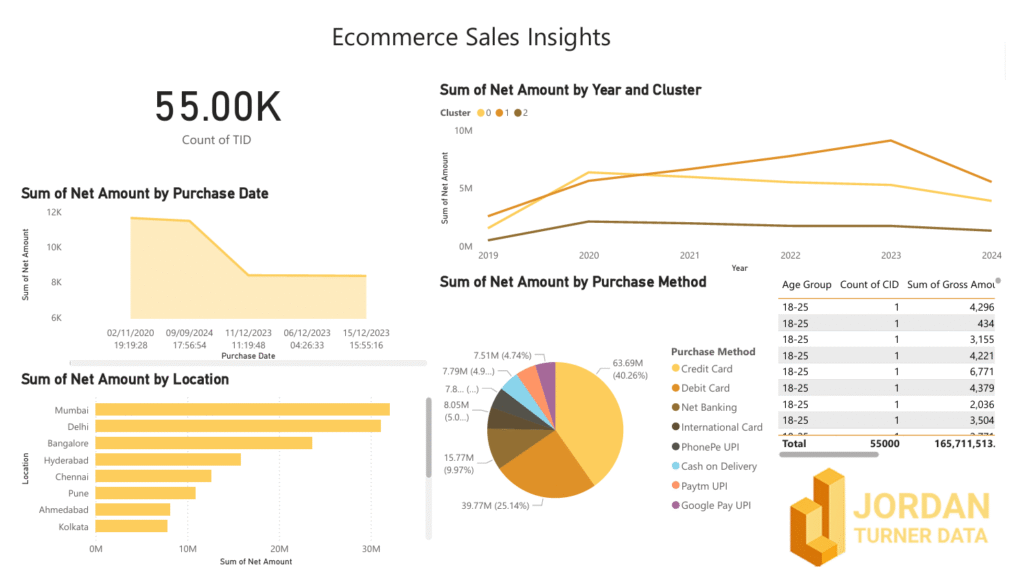
Unlock actionable insights into your eCommerce sales 📊 – How do sales trends evolve over time? 📅 – Which purchase methods drive the most revenue? 💳 – What locations are performing best for sales? 🌍 **Before:** Raw sales data 📉 → **After:** Actionable marketing & growth strategies 🚀.