A collection of Power BI visualizations showcasing real estate sales trends.
About This Dashboard
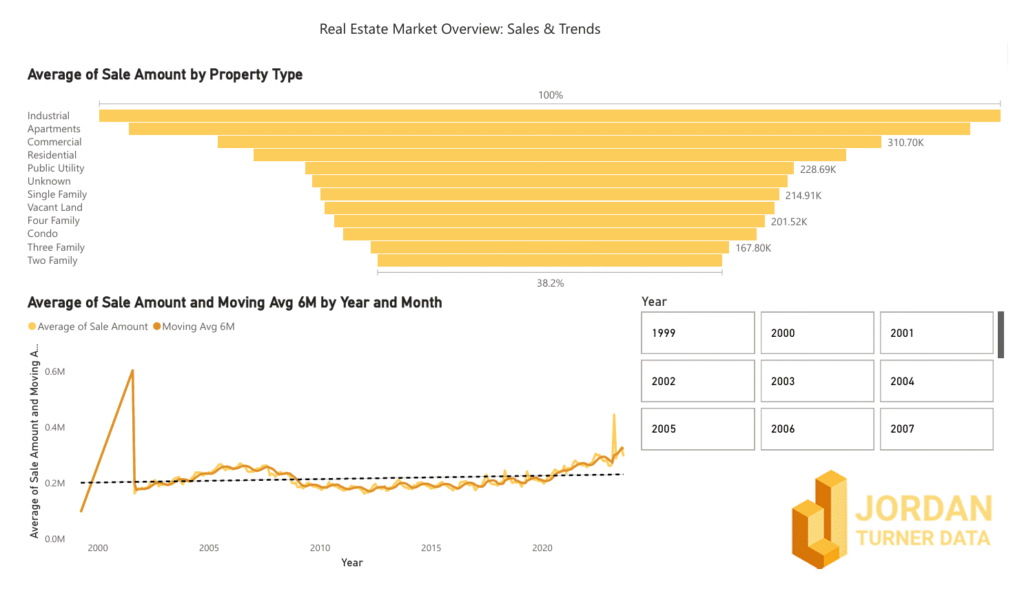
Real Estate Market Overview
🧩 Project: Real Estate Market Analysis Dashboard
🔥 Problem: Static spreadsheets and separate tables made spotting regional price shifts and property-type trends slow and error-prone.
🔍 Discovery & Research: • 📊 Analyzed sample public sales data to understand reporting gaps • 📂 Standardized datasets by region, property type, and date • 🎯 Identified key metrics: average sale price, sales-ratio, top property types, and 6-month moving averages
🛠️ Solution: • ✍️ Created DAX measures for average sale, sales-ratio, and rolling average • 📈 Built bar charts for “Avg Sale by Town” & “Avg Sale by Property Type” • 📉 Designed a dual-series line chart comparing actual vs. moving average trends • 🔄 Added slicers for Property Type, Town, and Year for dynamic filtering • 🤖 Configured a Smart Narrative visual for automated insights
📊 Tools Used: • Power BI Desktop • Power Query M for data cleansing & type conversion • DAX for all measure calculations
✅ Outcome / Results: • ⏱️ Transformed hours of manual prep into instant, interactive analysis • 🔍 Enabled quick discovery of town-level performance and market shifts • 🚀 Delivered a proof-of-concept for on-demand, self-service insights
👤 My Role: Led the end-to-end case study: sourced and prepped data, authored DAX measures, designed visuals, and set up the Smart Narrative.