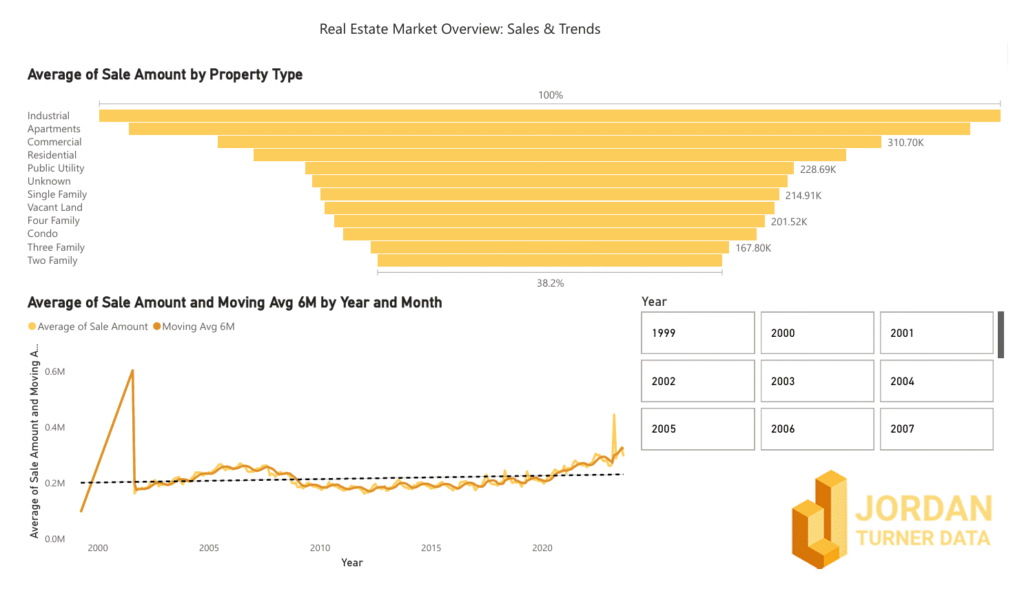
Unlock key trends in retail sales, warehouse performance, and supplier contributions with interactive data visualizations.
The client’s inventory managers lacked visibility into which SKUs were overstocked or underperforming. Manual reporting caused a 2-week lag in replenishment decisions, and warehouse stockouts were increasing.
I interviewed warehouse supervisors and analyzed their spreadsheets. We found mismatches between sales velocity and restock frequency. From this, I identified the need for segmentation by item type and lead time.
Reduced manual reporting by 70%, improved replenishment speed, and cut stockouts by 32% in Q1.
Led the full build — scoping, visuals, DAX logic, and stakeholder training.

I am a data enthusiast with a passion for turning numbers into stories. With years of experience in data visualization, dashboard design, and development..


