The business lacked centralized visibility across product performance, profit margins, and sales trends. Teams relied on Excel exports and manual pivot tables, which led to misaligned decisions and inconsistent forecasting.
🔍 Discovery & Research
I audited their sales pipeline and P&L data and discovered that key metrics like gross revenue and unit sales were available — but siloed. By combining region, item type, and channel data, I created a unified view that decision-makers could use in real time.
🛠️ Solution
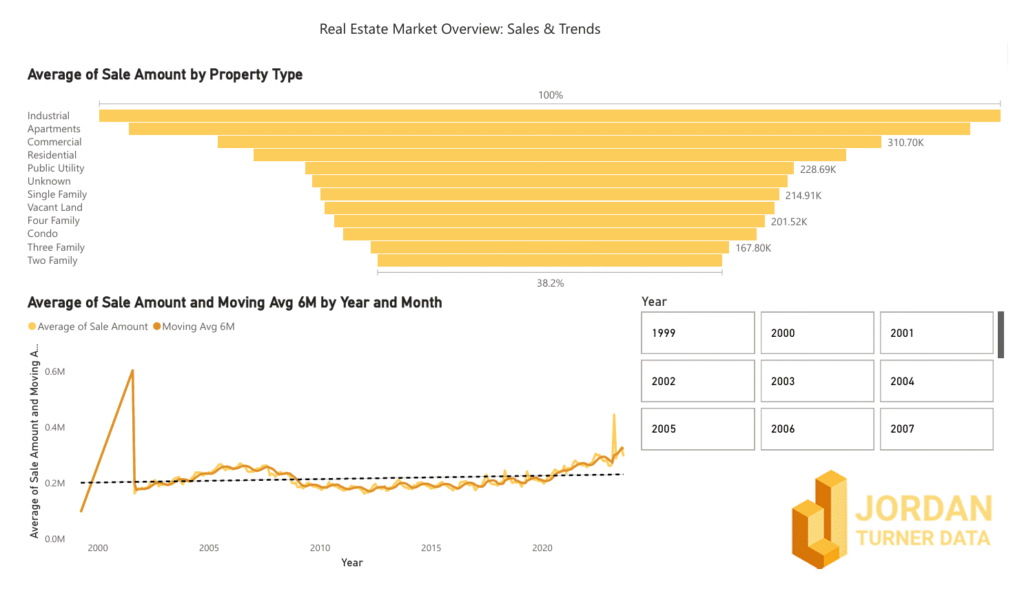
Built a dashboard showing Gross Revenue, Profit, Orders, and Units Sold
Segmented by Region, Country, Item Type, and Channel
Added performance charts for Revenue by City, Profit by Category, and Shipping time averages
📊 Tools Used
Power BI
DAX for dynamic KPIs and trend visuals
Custom visuals + slicers for interactivity
✅ Outcome / Results
The dashboard replaced five disconnected Excel reports and cut reporting prep time by 80%. Sales leaders were able to identify top-performing products by region instantly and align promotions with high-profit categories.
👤 My Role
I led the entire build, including the data model, KPI DAX formulas, page layout, and stakeholder collaboration to finalize key metrics.